
use a smart switch to turn off a lithium battery charger
visitors this year: 1,427 I know that I ought not leave things powered on. Knowing that is easier than remembering that an e-bike or drone or laptop battery is still connected. Below I show...
This section is about examining the data that sensors collect from experiments. Understanding the data that sensors provide is surely the reason for bothering to collect it! You can download csv files for all the graphs here to import into Excel or other software. Do use the topics/ keywords to find what you need.
handling data from experiments / home & garden / monitoring at home
by roger · Published Mar 2022 · Last modified Mar 2023
visitors this year: 1,427 I know that I ought not leave things powered on. Knowing that is easier than remembering that an e-bike or drone or laptop battery is still connected. Below I show...

visitors this year: 39 How data handling in science topics can be helped by using an IT tool called a spreadsheet program. Explained, with examples (from ‘IT in primary science’ by Roger Frost).

A ‘branching database is a must-try activity for sorting items and classifying animals.

visitors this year: 367 When it is icy they put salt onto the roads to melt the ice. What the salt does is to depress, or reduce, the freezing point of water. The result...

handling data from experiments / science experiments
by roger · Published Oct 2018 · Last modified Nov 2018
visitors this year: 78

handling data from experiments / science experiments
by roger · Published Oct 2018 · Last modified Nov 2018
visitors this year: 70

visitors this year: 322 If you were a chemical manufacturer you would certainly be interested in finding ways to increase the rate of production. One way is to do the reaction at a higher...
visitors this year: 34 Datasets (files) like the one below are useful in science. There is data to analyse by drawing graphs. The file below is in a ‘CSV’ format. Open it in your spreadsheet...

visitors this year: 49 Sometimes you need to graph several variables one after the other – for example, in this weather database, we plotted the daily maximum temperature against time. For clarity, we plotted...
visitors this year: 41 Datasets (files) like the one below are useful in science. There is data to analyse by drawing graphs. The file below is in a ‘CSV’ format. Open it in your spreadsheet...

visitors this year: 38 Datasets (files) like the one below are useful in science. They have data to analyse by drawing graphs. The file below is in a ‘CSV’ format. Open it in your spreadsheet...
visitors this year: 41 Datasets (files) like the one below are useful in science. They have data to analyse by drawing graphs. The file below is in a ‘CSV’ format. Open this one in your...

visitors this year: 66 Is mown grass in the compost heap really dead? When you cut the grass you remove its source of vital materials and the cut leaf ‘dies’. But when you feel...
visitors this year: 617 Plaster of Paris is white powder you mix with water and pour into a mould. You can make models with it while hospitals use it on broken limbs. When you...

visitors this year: 74 We scientists do the strangest of things. We wanted to see the temperature changes when you freeze and thaw things. So we took a ‘bun’ (a bread roll), placed temperature...
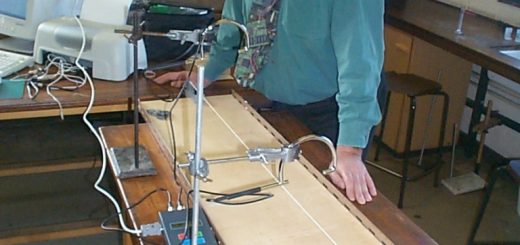
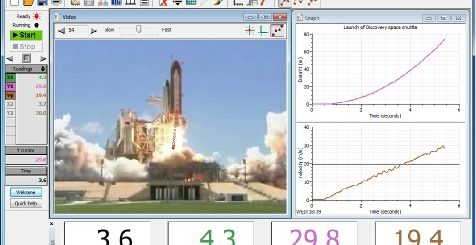
visitors this year: 352 A cart rolling down a hill certainly has energy which in turn affects its speed. But how does this speed change when you start the car off from a different...

visitors this year: 129 We used a turn (or position) sensor connected to the computer and recorded the swings of a pendulum made of a metal rod and a weight. We tried again this...

visitors this year: 275 You would think that when you heat up ice that it gets warmer bit by bit. And maybe that the more you heat it the hotter it gets. Well it’s...

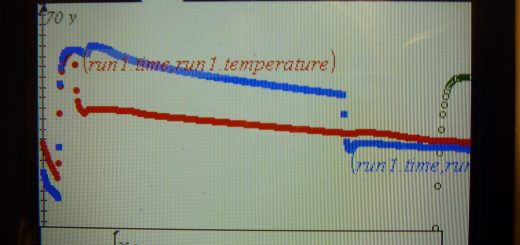
visitors this year: 4,785 I expect that when something cools, it will get cooler in a plodding kind of way. That’s true, but when something changes state, the cooling is not so steady.The graph...
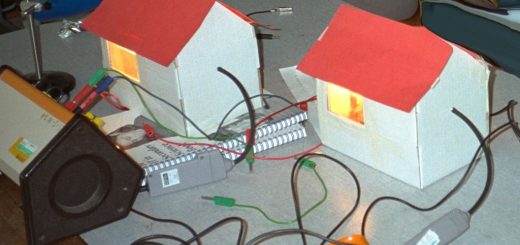
visitors this year: 63 We need to keep our homes warm in cold weather. We also need to do this as economically as possible. There are several ways to insulate your home and keep...

visitors this year: 45 What time does it get light in the morning? When does it get dark? Is the central heating working? I just had to know, so I took my data logging...
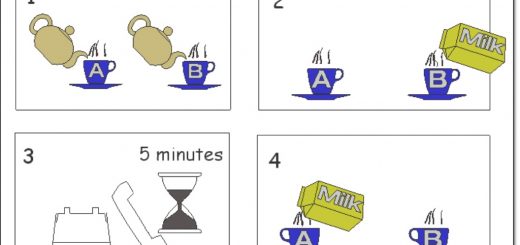
visitors this year: 153 The dilemma is this: the telephone range as I was making tea. Should I add the milk now or 5 minutes later, after I took the call? One way of...

visitors this year: 107 An infrared remote control unit sends messages, using infrared ‘light’ to recorders and televisions. Point a remote controller at a light sensor and it may be able to pick up the...
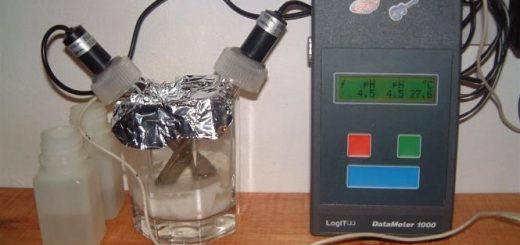
visitors this year: 112 The label on my milk bottle tells me how long the milk will ‘last’ at different temperatures. What do they measure to make this assessment? Is it the pH? I summoned...
handling data from experiments / primary school science
by roger · Published Oct 2018 · Last modified Apr 2019
visitors this year: 22 Scientists need to measure and communicate, to handle information and model ideas. In essence, they need to process information. Young scientists have similar needs. When they write, draw graphs, do...
visitors this year: 38 Fast forward to the future in Science Year Feature by Roger Frost for The Guardian (2001) Aiming for a world-record, Science Year kicked off on Friday 7th Sept as pupils...
visitors this year: 88 Here are screenshots from experiments we’ve tried over the years. You may find a worksheet for the experiment by searching for the topic or by trawling here. You can download the...
visitors this year: 82 Update – Coach 7 was available in 2018. In 2008 I wrote: Coach 6 Studio provides a learning environment where you or students can work with models or create models...
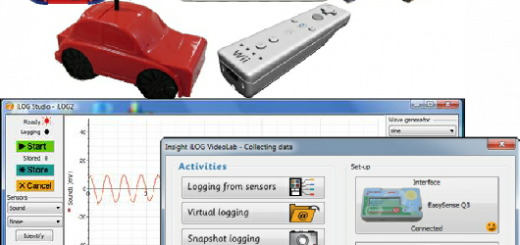
visitors this year: 63 Here is some excellent software that can collect and analyse data and it now works with a huge number of different brands. Called Insight and known to thousands of science...
visitors this year: 93 How much of the software used on computers in the 1990s is still being used on them today? One favourite, called Datalogging Insight, lives on today (2016) Insight is a...
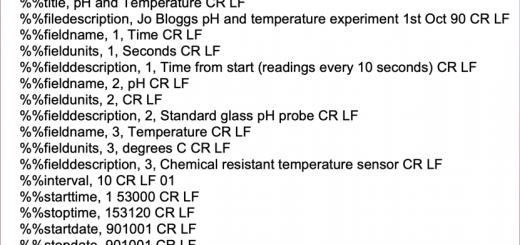
visitors this year: 107 Q. What is SID? A. It’s a standard file format that every data logging manufacturer is encouraged to support. The results of data logging experiments can be better shared in...
handling data from experiments / schools technology
by roger · Published Oct 2018 · Last modified Jun 2021
visitors this year: 192 The sensors and equipment you buy for school requires software made for it. There IS a generic program, called Insight (below). which works with lots of different manufacturer’s kit. It...
rogerfrost.com is a compendium of ideas for using technology with sciencey questions in mind. Started in 1995 to offer ideas to school science teachers, Roger Frost expanded the coverage to home automation, gadgets and sensors to measure, or understand, what’s going on around him.
To find things the search box, the menu and the keywords work perfectly (and we’re totally free as in advert free).
Roger Frost has been writing about technology since 1988 and this web includes articles; radio interviews with scientists and tutorials to use technology at home and the classroom.
Please enjoy and share this content. To say hi – there’s a reply button on each page that goes straight to me in Cambridge, UK. Send a private message on this page.
HOME AUTOMATION:


