project: smart electricity meter with historic energy use
fit a sensor to the electricity meter for a minute by minute readout
The UK electricity meter shows electricity use in kWatt hours, and a human sometimes pops by to read the meter and send you a bill. The meter has a flashing red LED, every flash of red corresponds to 1 Watt, after a thousand flashes you’ve used 1kW or about £0.40 of disposable income. A light sensor can respond to those flashes, so we can measure how much electricity we are using.
credit is due to the helpful folk at OpenEnergyMonitor
what this project achieves:
- measures electricity in any unit – Watts, kW or money
- display readings as a gauge or history graph on Home Assistant.
- uses Home Assistant’s ability to email readings; phone notifications or flash a smart bulb (eg when energy use is unusual)
- uses a photodiode with built-in amplifier TSL257-LF (~ £3.50 ebay) and an ESP32 wifi chip (~ £5).
- monitor a gas meter simultaneously so you get two sensors and double the value
- create an entity to use in the Home Assistant Energy Dashboard

how to connect up a light sensor and ESP32
The TSL257 photodiode has three pins, GND, 5v and signal. Connect a 10K ohm load resistor between signal and ground. (Luckily my RPi kit had a pack of 10K ohm resistors). CARE – this sensor is PLASTIC: I soldered the connections, using a large metal clip as a heatsink. Finally the sensor wires were glue-gunned, covered in heat-shrink and mounted in a 3D printed cover (below).


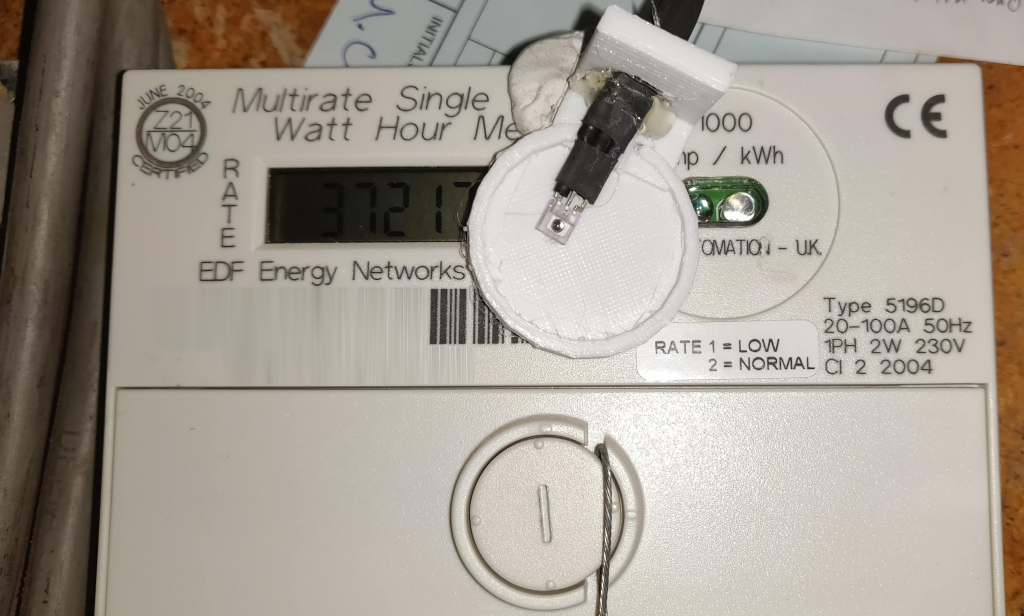
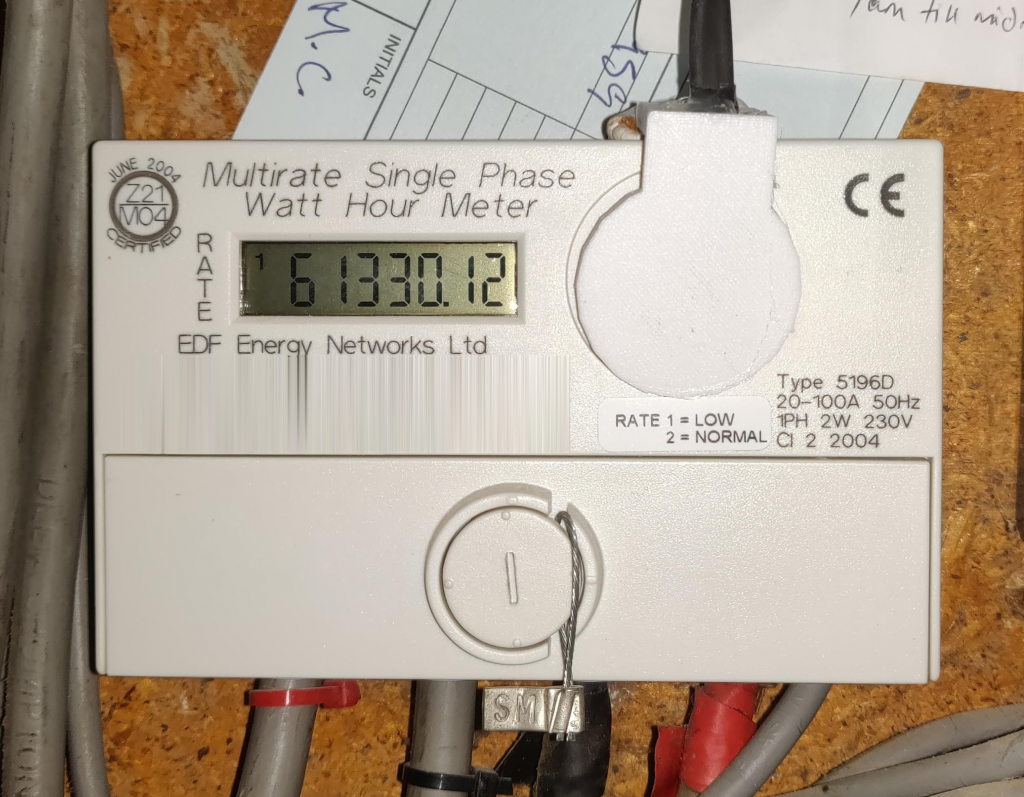
Thus far you’ve three wires from the sensor joining an ESP32. You now need a lead from a USB charger to bring 5v power and GND to the ESP32. I used an ESP32-CAM to provide me with an almost free extra camera. Here’s the box that I hope soon to make more attractive:


program (or install code) on the ESP32
For this step you need an already working ESPHome installation in Home Assistant as shown in HERE. It’s a project in four steps starting with installing Home Assistant on a Raspberry Pi – see HERE.
In Home Assistant go to the Esphome plugin and add a ‘new device’. A wizard walks you through. Eventually you see an editor where you can add the code below. Change the items in bold to suit your board, your wifi, your network and the GPIO pin you connected to. For more elaborate code see the Home Assistant Glow project.
substitutions:
   devicename: meter

esphome:
   name: ${devicename}
   platform: ESP32
   board: esp32dev

logger:

# Enable Home Assistant API
api:
   password: "YOUR HA password"
ota:
   password: "Optional password"

wifi:
 networks:
 ssid: "YOUR_SSID"
 password: "YOUR WIFI PASSWORD"
 manual_ip:
   # Set this to the IP you want on the ESP
   static_ip: 192.168.1.17
   # Set this to the IP address of the router. Often ends with .1
   gateway: 192.168.1.1
   # The subnet of the network. 255.255.255.0 works for most home networks
   subnet: 255.255.255.0

# The LED output and light sections are optional
 output:
   platform: gpio
   pin: GPIO4
   id: gpio_4

light:
  platform: binary
  output: gpio_4
  name: ${devicename} light

# THIS IS THE IMPORTANT PART - remember you connected the sensor to pin 12
sensor:
  platform: pulse_counter
  pin: GPIO12
  unit_of_measurement: 'Watts'
  update_interval: 20s
  accuracy_decimals: 0
  name: 'power meter'
  filters:
    - multiply: 60

# If you have a camera add the esp32_camera code section here (see here)
- Note the last bit of code above. The filter will convert pulses per minute to Watts. If you prefer a reading in kWatts, change ’60’ to ‘0.06’ and change the unit to’ kW’
- While you’re in the ESPhome section of Home Assistant look for options to VALIDATE your code and then to INSTALL (or COMPILE) it. The compile operation takes a few minutes as ESPhome assembles code libraries and creates a ‘firmware.bin’ file. Download this bin file. Flash the bin file using the ESPHome-flasher tool (see here).
- When the installing is done, power-up the ESP32. Home Assistant may ‘discover’ your new meter when it restarts. Otherwise go to Setting > Devices > Integrations > + > ESPHome. You might have to enter the IP address shown in the code above. You’ll then see the ‘meter’ entity that has been added to Home Assistant.
- Finally, go to the Home Assistant overview – the frontend view that displays your stuff – and choose Edit Dashboard (top corner). Add a ‘new card’ – use a history graph and a gauge to display your electricity power as follows.
display your meter in Home Assistant
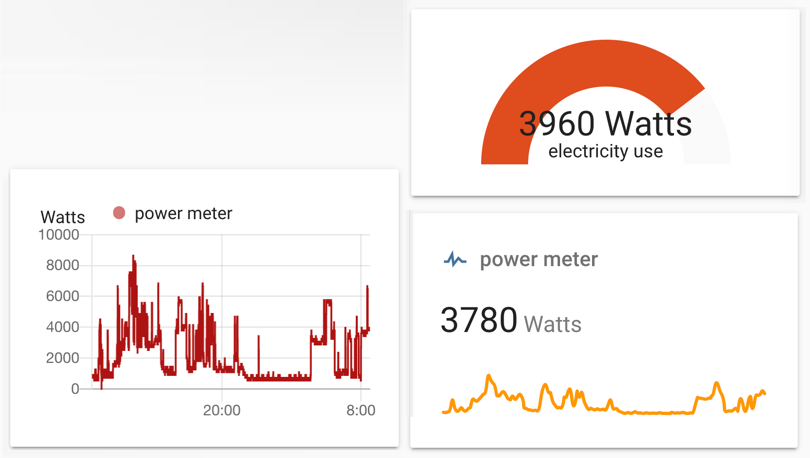
 # THIS IS THE CODE FOR THE GAUGE
entity: sensor.power_meter
 min: 0
 name: electricity use
 severity:
   green: 1000
   red: 3000
   yellow: 2000
 theme: default
 type: gauge
 max: 5000
 # THIS IS THE CODE FOR THE SMOOTH LINE GRAPH
type: sensor
 entity: sensor.power_meter
 graph: line
 hours_to_show: 24
 detail: 2
# THIS IS THE CODE FOR THE DETAILED HISTORY GRAPH
type: history-graph
 entities:
 entity: sensor.power_meter
 hours_to_show: 24
 refresh_interval: 0
now it’s working set up a notification
I find it’s well worth being able to see a time graph of electricity use: for example, a few years ago the time graph on my electricity monitor helped me discover unusually high usage – I tracked it down to an outbuilding where an immersion heater had been left switched on for two years. So I may to create a routine (or ‘automation’) to alert of unusual electricity use. I’m still thinking about which alert might be useful. Here’s one automation project.
there are other ways to monitor electricity
The lovely onzo meter (ebay £8.50 and upwards) uses a clamp on the mains cable. It provides a live reading of electricity use. Given its design and usefulness I suggest you own it if, like me, you don’t have a UK smart meter. The smart meters appear to be informative but I really want to see my energy use history.
Commercial electricity monitoring kits may require you to subscribe to a service or depend on it. That’s not much better than what I do myself so not good in the long term. For a couple of years (2014) I used the very reliable OWL Intuition. I sold the kit when OWL asked for a subscription.
The kit at OpenEnergyMonitor is something I will consider if I decide to buy solar panels.

update: Home Assistant Energy Dashboard kW hours
A newer feature of Home Assistant is an energy dashboard to bring together home energy use as well as solar panel energy production. As of 2022 the dashboard needs a measurement entity in kW hours (a unit of energy) whereas above my ‘smart meter’ produces an in-the-moment measure of kW (a unit of the ‘power’ I’m using). To convert kW to kWh we need to calculate the power use over time – in other words ‘do an integration over time’. Fortunately ESPhome has a ready-made calculation feature called total_daily_energy. See below for the code. It replaces the sensor section above and adds the energy calculator. The time component is needed for the time based calculation.
Compile and install the code on your ESP32. You’ll now have an entity, sensor.meter_energy_today to add to the Home Assistant Energy Dashboard.
# THIS IS THE IMPORTANT PART - remember you connected the sensor to pin 12
sensor:
  - platform: pulse_counter
    pin: GPIO12
    unit_of_measurement: 'W'
    device_class: "power"
    state_class: "measurement"
    update_interval: 20s
    accuracy_decimals: 0
    name: 'power_meter'
    id: myelectricity
    filters:
    - multiply: 60
    - sliding_window_moving_average:
        window_size: 5
        send_every: 5

  - platform: total_daily_energy
    name: meter_energy_today
    power_id: myelectricity
    device_class: "energy"
    state_class: "total_increasing"
    unit_of_measurement: kWh
    accuracy_decimals: 1
    filters:
        # Multiplication factor from W to kW is 0.001
      - multiply: 0.001

time:
  - platform: homeassistant
    id: homeassistant_time
alternative approach: how to turn kW into kWh using an integration
Instead of (or as well as) using the ESPhome total_daily_energy integration feature to calculate energy (kWh) from power (K) you can get Home Assistant to calculate. Add the code below to configuration.yaml. After a Home Assistant restart you’ll now have an entity, sensor.electric_spent to add to the Home Assistant Energy Dashboard. It should be numerically the same as meter_energy_today.
# PASTE THE FOLLOWING CODE INTO configuration.yaml with the sensor section

sensor:

  - platform: integration
    source: sensor.power_meter
    name: electric_spent
    unit_prefix: k
    round: 1
alternative approach: how to turn kW into kWh using a utility_meter
TBA: as of 2022, my energy dashboard is still in development because I want to know the balance of my individual peak and off-peak energy use. The following code adds some entities to Home Assistant including
- sensor.electric_daily_day
- sensor.electric_daily_night
# PASTE THE FOLLOWING CODE INTO configuration.yaml
utility_meter:

  electric_daily:
    source: sensor.power_meter
    unique_id: electric_daily
    cycle: daily
    tariffs:
      - day
      - night
Hi, great stuff! Is there a way to read a gauge directly? I have this kind of gauge: https://imgur.com/a/o2IzAcF
How can I track the red part with my espcam? Also another question, while using the espcam for it’s cam usage, can I use other pins on there for other sensors such as temp sensor and door sensor?
Hello and welcome to the world of home monitoring. Yes you can do all that Ron. I am working on a direct display of data using a TTGO st7789v which, with a sensor, is all you’d need for monitoring and a direct display. The TTGO module is an ESP32 + LED display in one package + several spare pins to add other sensors for temperature or presence detection.
In your case you attach my smart meter light sensor to the TTGO instead of the ESP32 that I used. There are Arduino library examples for this display that provide a very nice graphic meter – I’ll make progress with this future project when I learn how to incorporate that meter display example in ESPhome.
I’ve added a link to a project that uses that display. The cost of the TTGO is trivial. You don’t need a separate ESP32 module to measure. I needed two modules here because the display needed to be away from the oven.
https://www.rogerfrost.com/see-your-home-assistant-entities-on-a-ttgo-t-display-st7789v-tft-lcd/
Hi, just came across your website. this provides very valuable information to the novice smart home enthusiastic so thank you for sharing your knowledge. secondly, I like to know are you still using this step to monitor electricity usage. i was thinking to build something similar along with an oil level monitor. any watch out or lesson learned you like to share? thanks
Thank you Shahid. Both my electricity monitoring project and the heating oil monitoring project are in constant use here. They are extremely useful / highly practical examples of everyday home monitoring. I hope to provide a start from scratch guide to these tutorials. I’d recommend starting out to use Home Assistant and making say, a sun tracker to understand how this fits together. I’ve linked to some articles here and elsewhere to get you started. All the best wishes.
ELECTRICITY https://www.rogerfrost.com/how-much-oil-electricity-do-i-use-in-a-day-home-assistant-and-esphome/
OIL https://www.rogerfrost.com/an-electricity-usage-monitor-with-home-assistant/
SUN https://www.rogerfrost.com/aaacalculating-how-long-is-the-day/
HOME ASSISTANT https://www.rogerfrost.com/starting-out-with-home-assistant/
Thanks for taking the time to write all this stuff down. It has really helped me capture my home electricity use by monitoring the flashing light on the “smart” meter. Keep up the great work. it’s very much appreciated.
Good to hear so – you’ve no doubt overcome a few challenges. I don’t recall mine ever failing over three years use.
Hi Roger,
Thank you very much for this guide. I have the same meter as you. Would you mind sharing the STL for the cover you made for the sensor?
Many thanks
Sure. While the model is not beautiful it’s lasted years and the results tally perfectly with my real smart meter.
You can find two STL files linked in the post – this is one of them: https://www.rogerfrost.com/wp-content/uploads/2022/12/meter-sensor-shaped.stl
I’ve stumbled upon your very interesting post and am wanting to build exactly the same thing.
However, despite searching quite hard, I’m struggling to understand all the options available to get an ESP32 device, e.g pihut has over 200 results when searching for that text. Are there any specific devices that you’d recommend?
Thank you
Hi Richard
Yes 200 is overwhelming. Go to PiHut via Development Board > ESP32 > for a narrower choice. One thing: I wouldn’t use an ESP32-CAM as I did in this project because it is so much harder to upload code to. On Amazon or ebay look for a board labelled WROOM32 or NodeMCU or D1-mini that includes ‘ESP32’. Pay less than £12 or $12. You CAN use the older ‘ESP8266’ for the project above but why bother… (tip: the ESP32 has Bluetooth so if that’s mentioned you buying an ESP32). Look at the listing and make sure that you can identify the pins that you need to connect to as in my diagrams (eg GND GPIO12 …). Finally decide if you want pins or whether you want to solder securely wires into holes. I buy unbranded boards whereas PiHut sells branded ones such as Espressif ESP32 Development Board – Developer Edition at £15. However all of these are suitable:
Apologies for the delay in replying, life gets in the way!
Thanks so much for such a comprehensive reply, that selection looks very promising. Order being placed today!
Even in 2023 now that I have a smart meter this project is one of the most useful I’ve done.