data & datafiles you can download to analyse
Real results are often messy, but these all offer good material for discussion. This is the page from which you can download the results of other people’s experiments using sensors. Use the files as follows:
-
- as a graph image in Powerpoint
- import a file into a data logging program
- import the file into Excel as a comma separated file
How to download this data
-
Download everything, in one zip file here files.zip. Then you have to ‘import’ them using the menu in your program. You can import both SID or CSV files into Microsoft Excel or most data logging software.
- Many of the files come from experiments in the now free book ‘Data logging in Practice’. More graph screenshots in this Graph gallery.
![]() Download files marked with this icon to use in Datalogging Insight software. These are “ISA” files that Insight recognises. Go to the program’s file menu to open or import them. Thank Laurence Rogers, author of Insight software. for these files.
Download files marked with this icon to use in Datalogging Insight software. These are “ISA” files that Insight recognises. Go to the program’s file menu to open or import them. Thank Laurence Rogers, author of Insight software. for these files.
![]() Look for this icon below if you use other software. If you right click Photosynthesis: oxygen levels in an aquarium a menu will appear. Choose “Save target as” or “Save link as” and choose where to save it. Start Excel, open “files of type all files” and treat the file as comma separated data. Otherwise open your data logging program and look for the option to open or import ‘SID files’.
Look for this icon below if you use other software. If you right click Photosynthesis: oxygen levels in an aquarium a menu will appear. Choose “Save target as” or “Save link as” and choose where to save it. Start Excel, open “files of type all files” and treat the file as comma separated data. Otherwise open your data logging program and look for the option to open or import ‘SID files’.
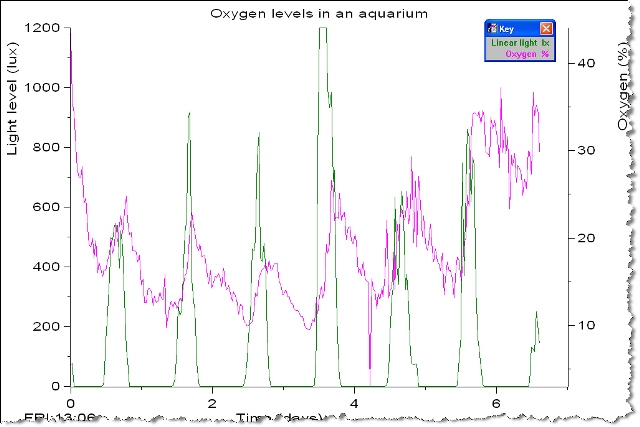
 Photosynthesis: oxygen levels in an aquarium
Click this ![]() for the Insight version (by Laurence Rogers)
for the Insight version (by Laurence Rogers)

Bread roll in a freezer (Laurence Rogers)
Click this ![]() for the Insight version
for the Insight version

Electricity – battery for the job (by Laurence Rogers)
Click this ![]() for the Insight version
for the Insight version
Toy car rolling down a slope (by Martin King)
Click this ![]() for the Insight Timing version
for the Insight Timing version

Temperatures in mown grass (by Laurence Rogers)
Click this ![]() for the Insight version
for the Insight version
Reaction rates – sodium thiosulfate (Martin King)
Click this ![]() for the Insight version
for the Insight version

Reaction rates and temperature (by Laurence Rogers)
Click this ![]() for the Insight version
for the Insight version
Latent heat – cooling curve (by Martin King)
Click this ![]() for the Insight version
for the Insight version
Heat – central heating house room temperature (by Roger Frost)
Click this ![]() for the Insight version
for the Insight version

Heating ice and water (by Martin King)
Click this ![]() for the Insight version
for the Insight version
Reactions – plaster of Paris (Laurence Rogers)
Click this ![]() for the Insight version
for the Insight version
Pendulum swings (Martin King)
Click this ![]() for the Insight version
for the Insight version
The coffee quandary (Roger Frost)
Click this ![]() for the Insight version
for the Insight version
Heat – day and night in the house – graph story (Roger Frost)
Click this ![]() for the Insight version
for the Insight version
Video recorder remote control pulses (Roger Frost)
Click this ![]() for the Insight version
for the Insight version
Freezing water (Roger Frost)
Click this ![]() for the Insight version
for the Insight version
Current & voltage in a resistor (Laurence Rogers)
Click this ![]() for the Insight version
for the Insight version
Capacitor discharge across various resistors (100µF) (Laurence Rogers)
Click this ![]() for the Insight version
for the Insight version
Pressure – temperature relationship (Laurence Rogers)
Click this ![]() for the Insight version
for the Insight version
Duff thermostat / refrigerator – but which? (Roger Frost)
Click this ![]() for the Insight version
for the Insight version

Teaching about acids – thermometric titration (Roger Frost)
Click this ![]() for the Insight version
for the Insight version
Enzymes – lipase and fat: with & without emulsifier (Roger Frost)
Click this ![]() for the Insight version
for the Insight version
Temperatures in mown grass over two weeks (Laurence Rogers)
Click this ![]() for the Insight version
for the Insight version
Thank you to Data Harvest
Many thanks to Data Harvest (www.data-harvest.co.uk) for the following experiment files. They will load into Data Harvest’s EasySense software, though most other data logging software and Microsoft Excel will be able to use them. If you just click a file here this will produce a page of numbers. That’s no good to you, so instead right click the icons when the pointer turns into a hand, and a menu will appear. Choose “Save link as” or “Save target as”. Open your data logging program and use the File menu to open or import a ‘SID file’. A SID file is a CSV text file (data separated using commas). You can import SID files into most UK data logging software. Microsoft Excel can handle these files too.
Candle burning
![]() Candle burns in a bell jar and the oxygen level changes. That proof enough? Remember to right click and save the file.
Candle burns in a bell jar and the oxygen level changes. That proof enough? Remember to right click and save the file.
A magnet dropped through a coil
![]() Steve Allen’s party trick is to drop a magnet through a coil, then ask what happens if he turns the magnet round and drops it the other way round. You need really fast logging to get results like this.
Steve Allen’s party trick is to drop a magnet through a coil, then ask what happens if he turns the magnet round and drops it the other way round. You need really fast logging to get results like this.
Magnetic field
![]() But look what happens if you just dangle a magnet from a twisted rubber band right next to a coil
But look what happens if you just dangle a magnet from a twisted rubber band right next to a coil
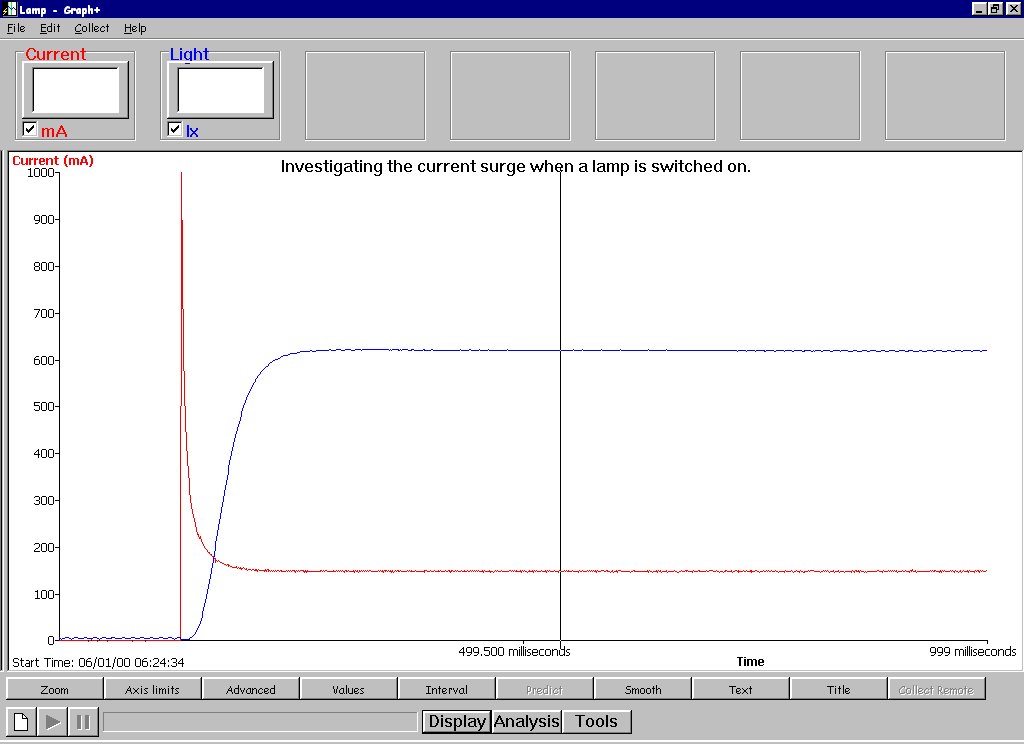
Current surge as a bulb lights
![]() The current surge when a bulb lights. See also the screen dump where I have adjusted the y axis. Results by Sue Plant at Data Harvest.
The current surge when a bulb lights. See also the screen dump where I have adjusted the y axis. Results by Sue Plant at Data Harvest.
Heat loss
![]() Heat – using a heat loss sensor based on the worksheet produced by Roy Barton of University of East Anglia. Plot the difference between Temperature 1 and Temperature 2 against heat flow – it forms a straight line. Results by Sue Plant at Data Harvest.
Heat – using a heat loss sensor based on the worksheet produced by Roy Barton of University of East Anglia. Plot the difference between Temperature 1 and Temperature 2 against heat flow – it forms a straight line. Results by Sue Plant at Data Harvest.
Sound waveform
![]() A waveform from our new sound sensor recording at 28,000 readings per second. The file is middle C of a piano. Use an Interval tool to find the time period from peak to peak = 3.885ms. Dividing 1 second by .003885 gives the result of 259.7, rounded up to 260 which I believe is the frequency of middle ‘C’. Not bad for a bit of homework. The sound sensor normally gives a decibel reading, but when switched to mv can be used for really fast logging. Not as fast as an oscilloscope but it gets results.
A waveform from our new sound sensor recording at 28,000 readings per second. The file is middle C of a piano. Use an Interval tool to find the time period from peak to peak = 3.885ms. Dividing 1 second by .003885 gives the result of 259.7, rounded up to 260 which I believe is the frequency of middle ‘C’. Not bad for a bit of homework. The sound sensor normally gives a decibel reading, but when switched to mv can be used for really fast logging. Not as fast as an oscilloscope but it gets results.
Acid-base
![]() and
and ![]() Two acid-base titration results files, the first is done by adding acid and using ‘snapshot’ to take a reading at each point. The file shows points as each 2 ml of alkali was added by pipette – we used 0.1M sodium hydroxide and 0.1M hydrochloric acid. This is from our new KS3 worksheets. The second file, titre.sid is the traditional alkali drained from a burette into acid.
Two acid-base titration results files, the first is done by adding acid and using ‘snapshot’ to take a reading at each point. The file shows points as each 2 ml of alkali was added by pipette – we used 0.1M sodium hydroxide and 0.1M hydrochloric acid. This is from our new KS3 worksheets. The second file, titre.sid is the traditional alkali drained from a burette into acid.
Food as fuel
![]() Food as a fuel – burn vegetable oil and compare different oils. It needs zooming to see it properly. By Reshma Syed
Food as a fuel – burn vegetable oil and compare different oils. It needs zooming to see it properly. By Reshma Syed
Measuring force
![]() A file to show what happens in a collision between two hard surfaces measuring force. We repeated the collision with the same mass and at the same speed where one surface is ‘cushioned’. The area under the graph in each case is the same. We kept repeating the collision with the hard surface – the force sensor gives such consistent readings.
A file to show what happens in a collision between two hard surfaces measuring force. We repeated the collision with the same mass and at the same speed where one surface is ‘cushioned’. The area under the graph in each case is the same. We kept repeating the collision with the hard surface – the force sensor gives such consistent readings.
Thanks to Barbara Higginbotham of Data Harvest for sending these.