teacher training projects
As well as run one-off courses for teachers in schools, I had a central role in some bigger projects with a wider community of teachers. There was a national project called GEST which gave local councils extra equipment and funding to support schools. I worked for NCET on that one. There was another called NOF which pretty-much forced every teacher to get better at IT. I’ll save that NOF story to instead focus on a project which was very effective for what it cost. The place was Bexley, outer London. The project concerned portables and science. Education adviser Clare Johnson loaned a dozen teachers a laptop each for a term. The teachers were offered five evenings and three days training with the task that they had to develop some teaching resources to share with the local schools. Below I’ve recorded the things that the science teachers chose to do and why I thought it was good. Our aim as trainers was to give the teachers skills to use a variety of tools such as sensors, the Internet and science models.
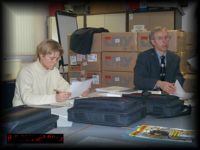
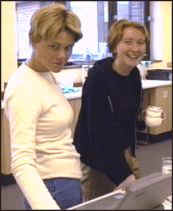
LEA Advisers were Clare Johnson; Ron Margetz. The trainers were Roger Frost and Frances Howlett. The teachers were: Elizabeth Hayman; Khaleed Hameed; Graham Haynes; Stewart Branfield; David Adams; Amanda Wray; Kate Broadhurst.
Data logging – using sensors to take measurements in science experiments:

Y7 – Temperatures Project
In a lesson on insulation, the teacher showed pupils how a data logging system could record and plot temperatures automatically. He gave them the graphs made from two situations – one showed how the room temperature changed overnight, the other compared containers insulated with loft felt, wool and a T-shirt. Pupils went to the network room and used the word processor to answer a series of questions about the graph. In subsequent lessons, on adaptation to a cold climate, the teacher notes how well the pupils recalled their work on the computer.
Y7 – Measuring speed
An example of creative data logging here using two light gates positioned at each end of a ramp. The computer starts recording, a toy car rolls down the slope and two ‘blips’ appear on the screen – the gap between these marks measures the short time of the journey. Time is easily measured and children are introduced to an interesting method of recording time. It was easy to draw out the connection with the way police cameras capture pictures of cars against the lines on the road. “All appreciated how it worked”, says Kate, “they also clearly saw the time scale reducing as the angle of the slope was changed”. Given the success of this, there was a taste to do more and to record, and graph the distance of projectiles with the help of a spreadsheet.
Y10 – Energy in burning fuels
In this practical, the pupils used a spreadsheet to compare the heat produced by burning alcohols. The spreadsheet helped to do the calculation and to prepare a graph. The reports were used as an example of an assessed practical for their exams. The exam board were happy with this too. A pristine sample of pupils work is included here.
Y10 – Various chemistry
The group compared rates of reactions using six dilutions of acid and a data logger. It is usually quite a challenge to do and to graph six experiments consecutively, but the technology helped make this possible. They also compared the heat loss from cans of water using temperature sensors. As often happens the cans do not start at the same temperature – however, the data logging software allows them to correct for small discrepancies: it measures the net change of each graph so this corrects for the error.
Y10 – Rate of a reaction
Year 10 pupils used a balance connected to a PC to measure the Rate of the reaction between marble chips and acid. Performed using 1M and 2M acid, the graph shows the change and the difference between them.
Y13 – Chemistry pH titration
The teacher used a burette to drip acids acid (methanoic acid, ethanoic acid etc) into sodium hydroxide, He used a pH electrode to log the pH changes, and produce a graph of pH against time. By converting the data to a file that a spreadsheet program could read, he was able to convert the ‘times’ into volumes by doing a calculation. The result was a set of more meaningful graphs.
Handling data by using ICT to sort lists and create graphs, pupils are able to look for a greater variety of patterns in their data. At Y11 the pupils are looking for the same patterns but the ideas are more abstract.
Y9 – Nutrition & comparing breakfast cereals
Here the aim was to develop pupils work with recording, looking at graphs and interpreting them. The class would use a spreadsheet to look for patterns in the nutritional data on cereal packets. Although a finished data file was put on the network for the pupils to analyse, it soon became clear it the pupils would appreciate the work better if they keyed in the information themselves. This worked well, while a higher ability group not only completed the task efficiently, they had time to spare embellishing their printouts.
Y11 – Periodic Table
The teacher describes the activity: Used periodic table software with an A level chemistry group. They examined patterns in the properties of the elements. The software plotted out the trends in atomic radii and ionisation energy. They were able to relate these two properties – i.e. bigger atoms lose electrons more easily. Printed out graphs.
Research: pupils use the Internet or a CD-Rom encyclopaedia to research a project. The older groups use the Internet to look up current information while the younger groups use books or a CD-Rom encyclopaedia to find out about information – about the body or metals, that hardly changes from day to day.
Y7 – Organs of the body
Pupils collated information on living systems – different groups covered different organs. Their self-motivation was very evident and the work generated lots of questions about the body. The teacher noted that this group seemed to have more experience of PCs than her older group – it could have something to do with their home and primary school experience.Y8 – Research on the uses of metals
In a Periodic table topic, a mixed ability group researched facts about metals. They went to the library in small groups for a double period, using books and the Encarta CD-Rom to find information. They saved pictures and text on disc. Later they were to go to the IT room and use Microsoft Publisher to assemble a project page each about metals such as Iron, Aluminium, Copper.

Y9 – Smoking health project
Taking about 3 hours overall for this project, year 9 researched facts about smoking. They used books, an encyclopaedia, Internet pages found through a ‘Yahoo’ search, the BBC Health Education pages, and a CD-Rom Encyclopaedia of Science. Again small groups were sent to the library where they could use several PCs.
Y10 – The effect of humans on the biosphere
Helped by her librarian, who set up the library PCs with the Encarta encyclopaedia, the Times newspaper on CD-Rom and the Internet, this teacher’s class researched a range of environmental issues. Their brief was to prepare a wall display with facts and figures about an issue. At the end of this, they would also have to give a presentation to the class and the head teacher. “Everyone, and the girls in particular, did nice work. Their presentations were surprisingly good”
Revision – multiple choice tests and on-screen exercises add novelty and help to make revision less of a chore for pupils.Y7,
Y10 – On screen word exercises
Fill in the gaps exercises and crossword puzzles on any topic. The teacher found ‘Hot Potatoes’ software that let him construct several revision exercises which work on screen like web pages. Another free acquisition from the Internet with details included.Y9 – Revision on Mrs Gren
Used a Dorling Kindersley Encyclopaedia of Science and a revision title called ‘Test For Success’ with a year 9 group. The group soon focused on the material. The teacher noted that the software seemed to raise the level of the pupils’ questioning.
Using software models – some ideas, like the growth of a population or the behaviour of an electric circuit are dynamic and best appreciated through practical work or software models.
Y7 – Electrical circuits
Used Crocodile Clips Elementary software to make a range of electrical circuits. The teacher notes, “It works no loose connections or broken bulbs”. He found the software free on the Internet.
Y8 – Populations
The teacher describes the pupils response: Boys and special needs took very well to using the ‘Creatures’ software on populations. “They really went for it”, adds the teacher who came to see computers as a possible way to raise the achievement of boys in science. Over four hours, the pupils took turns at the computer as the others did related work on food chains. They appreciated the ‘basic’ idea well as a result.Y8 – Electricity
The teacher describes the activity: Used Crocodile Clips Elementary software (see above) to make a range of electrical circuits. The teacher showed the group how to construct a variety of different circuits. These circuits could be seen working on the screen. The teacher was able to demonstrate the software using a multimedia card they purchased to send the computer output to a TV screen. The science technician helped to set up all install the card.
Y9 – Body cut out word file
A class cut-out activity using the graphics feature of MS Word – the pupils arranged computer graphics of the organs of the body. More efficiently than with scissors and glue they rearranged and labelled the pieces on the screen. the file can be found at www.rogerfrost.com/body.htm
Y9 – Predicting populations
Pupils used software that simulated the fate of a population of foxes and rabbits. The teacher presented them with a variety of scenarios and for a homework activity, asked the pupils to predict how the population fared. Next lesson they used the software to observe how good their predictions were. His questions, and their answers are included here. He notes that the girls could work out for themselves where they might have guessed wrongly.
Summing up
This was a special project. Firstly the teachers showed the dedication to see the project through. They deserve a commendation for the hurdles that they overcame in making their laptops work as they wanted, connecting to the Internet, using email, and gaining access to technology in school. Secondly all learned very fast: the pupils were put into situations where a lot more than usual was expected of them – both in terms of their skills with computers and the level of the science they were dealing with. Furthermore, although computers have remarkable capabilities, they also have a remarkable ability to throw up the unexpected. The teachers learned to manage these situations, stay determined and calm too. Finally although they were put on the spot and asked to use technology, the teachers sought to find applications that not only matched their current topics, but which also improved on what they were doing. This critical approach to computers is healthy, welcome and holds out encouraging prospects for future work.

The teachers offered this advice
-
- The teachers listed numerous tips on how to make progress in school. Among these were to obtain the support of school management and involve them in the work and get them to observe lessons.
-
- To put time limits on tasks; keep boys enthusiasm to use the computer in check; encourage sharing of the keyboard – perhaps by reassuring pupils that this isn’t their last chance to use a computer.
-
- To work towards developing a fair IT room booking system; find a willing helper in school; ask the right person for help in say, putting files and programs on the school network.
-
-
- To get a computer projector that puts the computer image on a TV screen
- To prepare for bottlenecks when it is time to print out work; to gain experience with using computers with whole classes – it will help to adjust your expectations and your lesson planning.
-