measure heating oil usage with a sensor and display on an energy dashboard – easy

how to make a heating oil tank level sensor that’s more useful than anything you can buy. This sensor…
- can measure oil level in any unit – litres, kWh, gallons or days until I need to refill the tank
- displays the oil level on a time graph as well as show daily / hourly energy cost on a bar graph
- show how much free space there is in the tank and when you’ll need to order allowing for an x-day lead time.
- sends an email alert when needed, displays in a web browser or on your phone and works in Home Assistant on a Raspberry Pi.
- by fluke I can power my sensor with a USB mains adapter. Otherwise you need a battery power pack in an waterproof electrician’s housing. To improve the battery power I’d replace my ESP32 board with the lower power ESP8266. The battery power pack might be 6 x 18650 cells based on this power pack I made
- this sensor could instead monitor the salt level in a water softener or the water level in a tank
Background: homes like mine use oil as a fuel to keep warm in winter. Over a year I will need three or four deliveries of oil but I had no way to predict when I’ll need more oil or know how much to order. And I really don’t ever want to run out of oil. The ‘heating oil’ burns in a boiler in the same way that methane gas burns in gas boilers. This runny liquid may also be called diesel or white spirits or turps or paraffin or kerosine.
I asked local firm Shelford Heating to quote me for an Apollo oil level sensor and they came back with a price of £220. That was 20 years ago. Today there are numerous Apollo models that offer a display that’s good enough for ordering. But today there’s also Kingspan / Watchman Sensit which pretty much achieves the objectives of my DIY project. There is ready-made code to integrate the Kingspan sensor with Home Assistant and use the calculations in my project. I would have bought this kit but it would not fit my tank. Smart alternatives which may or may not connect to Home Assistant include Smart Oil Gauge by Connected Consumer Fuel (there’s a project to extract data from Smart Oil Gauge) or FoxRadar/OilFox (which is a service with a monthly subscription).
what’s needed for this project
- soldering skills if you want to make reliable connections – you do
- if your tank is outdoors you’ll need a waterproof housing and eg Kafuter K-705 gel and a 5v power pack to the oil tank
- Vl53L0X time of flight sensor connected to an ESP8266 or ESP32 development board using eg 18 gauge wire and heat shrink tubing
- Home Assistant running set up on a Raspberry Pi
- if you want email notifications you need your email account server settings
- if you want to keep long term records you’d need to send the data to Google Sheets (optional)
there are other posts on this topic
- the detailed version of this page
- an earlier oil tank level sensor using the ultrasonic JSN-SR04T
- how I mounted and calibrated the sensor for my oil tank
- the final step where I get Home Assistant to calculate when I need to order oil and display that
- the trick to send sensor data from Home Assistant to a spreadsheet
make the oil level sensor (Vl53L0X) and communication unit (ESP32/ESP8266)
While this is a clunky DIY sensor it has served me reliably since 2018. The key advantage of a DIY sensor is less to do with cost – it’s to do with the ability to get the oil level data so that I can do the maths, graphs and notifications in the way I choose. If I had a FoxRadar sensor I’d only be able to see my data in their app.
I also get to choose the sensor used. I’m using a ‘time of flight’ sensor that works by sending infrared blips to the liquid surface and then measuring the ‘time of flight’ to estimate how far away it is. It can send correct values at short range ie when the tank is full. I previously relied on an ultrasonic sensor which unfortunately cannot measure at short range. The ultrasonic sensor provides the same oil level whether the tall is full or 200mm below full. Eventually the level drops by 200mm and the readings become very useful.
As well as an oil level sensor I need a circuit board which can take readings from the sensor and send it to my system. Normally this would be beyond my abilities but by using ESPHome software people like me are able to do this with ease. The circuit board, called an ESP32 or ESP8266, is bought off the shelf. It has built-in wifi capability and it needs your wifi password to start sending data to a Raspberry Pi running Home Assistant. If you don’t have a Raspberry Pi you might install Home Assistant on an old laptop to follow along with this project.
One last detail is that you’ll need to measure up your oil tank so that you can turn an oil level reading into litres (and in turn into kWh and money). For example, the oil level sensor measures the distance to the top of the oil in the tank. Take that reading in mm and multiply it by a number based on the volume of the tank.
A last, last detail is to mount the sensor on the tank and protect it from oil and rain. Some ideas are detailed here.
now connect your sensor to Home Assistant
When the sensor is powered it will connect to your wifi and start sending information over your home network. If there’s a Raspberry pi there running Home Assistant this information can be picked up and displayed in many useful ways. Below I’ve shown a few examples of that including a history graph and a gauge. Home Assistant will now store all the readings from the sensor and the last two weeks of data will be readily available for about two weeks. As explained in the introduction, some people have managed to get Home Assistant to pick up the readings from Kingspan / Watchman Sensit oil sensor. If you manage to do that you can set up graphs similar to the following:


refining my oil level sensor
After several months use I needed to address some issues and modify my sensor data.
- maxing out: at low oil levels the sensor is bouncing off a metal strut inside the tank so I need to relocate the sensor somewhere else. My readings plateau when the tank drops to 20% full.
- calibration: the sensor measures in metres so I have to calculate the litres. My tank has a perfectly regular shape from top to bottom – so by measuring dipstick depths, I found that 100cm of tank depth contains 105.3 litres. In the code below the last two lines (filter and lamda) do this calibration. The two lines can be edited or entirely omitted to suit your tank.
- the readings were a bit noisy. To counteract this I calculate the sliding average of an oil level reading. In my final version I replaced the sliding average with a Kalman calculation.
- it was suggested that the ‘oil used’ graph should fall, not rise, so I made the reading negative. This also makes it easier to know how much oil to order. I should rename the sensor ‘oil used’ because the number it returns is the amount of oil I need to buy to fill the tank. Next I really don’t need an oil level reading every 10 seconds so I increased the update interval. The commercially available FoxRadar takes only a few readings per day.
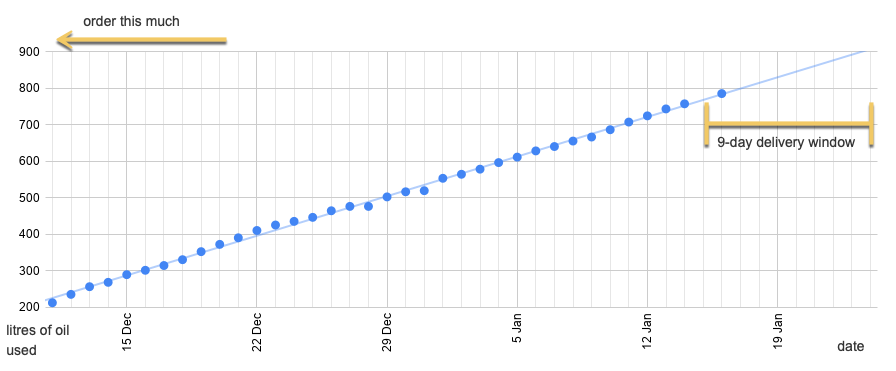
when do I need to order more oil?
The first nice consequence is that I now know how much oil I need to order and how much I use. We might now need the following:
- to predict the date when we need to order more oil and get notified – see how I calculate when I need to order more oil using Home Assistant
- to store our oil use in a spreadsheet as well as record the outside temperature – see send sensor data from Home Assistant to a spreadsheet
the trace is very noisy – how to remove noise from the trace

The code below includes ways to remove noise from the readings. The quantile filter removes ‘outliers’ (the readings that are wild). Having removed the outliers we use a kalman calculation to smooth the graph. The results are good however occasionally the oil kWh wavers, goes negative and makes a mess of the Energy Dashboard. We therefore create a sensor that doesn’t go negative. This code produces four entities – only two are needed.
- “oil kw-raw” – the raw reading from the sensor as kWh. Includes a tank fiddle factor (1000) to turn mm into litres
- “oil kalman” – we do a ‘Kalman’ calculation on the raw kW to smooth it
- “oil_level” – we take the smoothed “oil kalman” and convert kWh to litres by dividing it by 10
- “oil_kalkw” – we take the smoothed “oil kalman” and prevent it from producing a lower value than the last reading.


edit the Home Assistant energy dashboard
Go to Settings > Dashboards > Gas Consumption > Add Gas Source and find the entity for oil usage in kWh. In my example above this would be “oil_kalkw” or “oil kalman”. To track the costs enter a number e.g. 0.085 GPB/kWh or create an input number (in Helpers) such as input_number.oil_now_cost with a value of 0.085.
Example: if heating oil costs £0.85 per litre which ideally burns to produce 9 kWh of energy. For simpler maths I call this £0.85 for 10 kWh or £0.085 for 1 kWh. You could tweak this to allow for inefficient burning. If I had a home that didn’t use and leak so much energy I might see the value of pretending to be accurate.


If you’re more interested in water tank levels not oil tank levels:

Do you find that this sensor is Noisy for you? I’ve extended out the number of reads to once a minute, average for an hour and it still a little up and down.
Thanks for writing in. YES! I’ve added a picture of the output to the post. It is noisy but I’ll return to fix this when my urgent (water level) situation has passed! Let’s know id your config improves on mine.
Thanks for the Reply. I’m currently tweaking window size and the sample frequency.
I’ll have a few tests over a few days and will come back and update this, tonights test is
# to stop reading for a predefined interval
deep_sleep:
run_duration: 10s
sleep_duration: 60min
and this is in the sensor field
– sliding_window_moving_average:
window_size: 10
send_every: 10
I want it to give me an average of the 10 seconds it is awake; but the last log test i just did indicates that it is keeping track of that last 10 checks somewhere else.
Hello Dennis
Thank you for adding more truth to the idea that this is a noisy sensor. We can’t exclude the idea that the platform / ESP32 might be part of it but no matter, you’ve found a solution for a still very useful sensor.
GRAPH SMOOTHING / NOISE
Well done for finding ‘quantile’ as it seems to more suit what I’m looking for by omitting outliers. I’ll note that you’re taking a fantastic number of readings and doing the maths over 15 minutes – a duration which suits our slow use of heating oil.
In Home Assistant I used a Statistics graph which helped – but by averaging.
CALIBRATION
My tank is old-style metal and rectangular. I will tweak the fiddle-factor when it gets topped up for the first time. Just now the figures are good enough to know how much heating oil is used daily and how much to order.
INDENTING YAML CODE
This web page messes up indents – go to esphome.io to see how to do it: https://esphome.io/components/sensor/index.html
UPDATE:
Cheers for the idea to use a quantile filter and sliding_window_moving_average on the oil tank ‘tof’ sensor.
In an update of my post, near the bottom, you’ll see that I’ve stacked one sensor after the other and the effect is pretty good … or much improved.
The Esphome quantile code removes outliers and this is followed by your second filter: sliding_window_moving_average.
Thank you for the pointers that led to this.
SLEEP
I recall a report somewhere that mentioned what happens during sleep – in any case good luck there Dennis.
BATTERY POWER
If you’ve switched over to battery power pls let us all know if battery life is reasonable.
Changed this over to use quantile which looks like it really smooths out the curve. Still a bit of noise but looking much better.
I have the device on usb power so i take a lot more samples.
Also, had a different take on measurement. Using the tank’s maximum capacity and a simple formula tells you how much oil is in the tank
sensor:
– platform: vl53l0x
name: “oil_level”
address: 0x29
id: myoillevel
update_interval: 1s
long_range: false
accuracy_decimals: 1
unit_of_measurement: “Gallons Remaining”
filters:
– lambda: return 330.0 – x/1.10*330.0;
# – lambda: return x * 1053;
– quantile:
window_size: 900
send_every: 900
send_first_at: 900
state_class: measurement
Was creating similar for my mum, then found she had an old Watchman ultrasonic, but I’d planed to use the VL53L0X/1X. Thought I’d combine with the lilygo T-QT Pro, but only for the visual feedback during setup. Found some sensors that had a nice cover on aliexpress, doubt they’re tested for oil fumes but what I ended up with: https://www.aliexpress.com/item/1005003091941068.html (2nd and 3rd variants)
Thank you Tyeth for the link! I’ve incorporated your find in the post. I agree that this cover, or its mount, needs long term testing against oil fumes – in an earlier project using a sonar distance sensor all of the ABS plastic of that sensor has dissolved. One ray of hope is that the PLA plastic used to print a holder mount HAS not perished. I continue to look for a glass/metal casing.
And the use of a Lilygo T-display does indeed make it mum-friendly! That’s good. Those displays are excellent and these days there’s code to have a slideshow of a graph and another output.
(My alert is an email that sends daily / when level is lower – I’m hoping for an automation to put an oil order date in the Google calendar but the maths and coding waits for another lockdown).
Hi Roger
Great write up !
with regards to Current / power reduction / optimisation when on battery.
Does the Vl53L0X board uses standby current when the ESP is in deep sleep? looking at this website “https://www.instructables.com/WiFi-Oil-Tank-Monitor” they use a transistor connected to one of the outputs, thus perhaps an adaptation of this for ESPhome which turns on a dedicated pin to the base of the transistor, hopefully when in deep sleep the pin will be off and transistor not charged?
Do you think this will work?
esphome:
name: oil-sensor
on_boot:
then:
– delay: 5s
– output.turn_on: sample_pin
output:
– platform: gpio
pin: 5
id: sample_pin
deep_sleep:
run_duration: 30s
sleep_duration: 2min
Thank you Stuart. I haven’t yet switched to battery power but I know another contributor on here who has – contact Kev aka this guy on youtube https://www.youtube.com/c/Mr12v
Is this example actually measuring oil? or not
Did you show an example of how oil can be used with water?
Is this example actually measuring oil? Yes, oil. In litres.
Did you show an example of how oil can be used with water? No.
What do the values 1018 or 330 stand for?
– lambda: return (x – 0.034) * 1018 * 10;
Can you explain this line, please?
x = the distance the sensor measures
0.034 = some offset like sensor packaging ???
1018 = ??
10 = ??
Where do you input the tank dimensions for the calculation?
Thanks for writing in with a question. I’ve a few posts on this topic and the explanation* for the factors hasn’t carried over to each post.
x = the distance the sensor measures
0.034 = some offset because values do not reach zero on a calibration graph – this is the intercept
1018 = a tiny fiddle factor specific to my tank based on a few tank top-up refills. It’s 1.018 and because I want litres it’s 1.018 * 1000
10 = convert litres to kW. It should be 9kW per litre but I used 10kW.
* https://www.rogerfrost.com/water-or-oil-tank-level-mounting-a-vl53l0x-time-of-flight-sensor/
There’s a new post coming in the next few days on my success to add Oil consumption to a HA energy dashboard