project: plug-in energy meter with graphs of energy use over time

‘Smart meters’ and metering devices usually measure the electricity used by the whole house*. However I prefer to pay attention to the electricity used by individual devices, such as a combination oven, fan heater or the TV. The excellent Belkin Energy Monitor** tells you the Watts or average cost to run anything that has a plug. The Wemo Energy Monitor smaty plug does much the same. What they don’t do is give you the history of what’s happened.
You’d need the history if you wanted to know how much energy is used to cook a pizza, or run a computer 24/7, or watch TV or do a tumble dry. There are devices to tell you how much energy a dishwasher uses in a year, but it is probably more useful to know what a wash costs each time. This project arose from a need to know if a water pump was overrunning as this would lead to a flood.
Seeing a graph of on/off times is the key feature of this project. The sensor I use is built into the inexpensive Sonoff POW device shown above. In addition you’ll need a Raspberry Pi running Home Assistant. Once your data finds its way into Home Assistant you can display a power gauge or a history graph or show costs in money and even send readings to a Google spreadsheet every hour for as long as you wish.
*See my smart meter project here or a commercial system such as openenergymonitor

The Sonoff POWR2 is a smart plug that measures current and voltage. I’ve boxed it up as shown as it’s made for permanent wiring (There’s no pass-through plug and socket). It normally connects to an app called ewelink. The app doesn’t provide the history of the electricity used in between on times. So I flash it with ESPhome firmware. I view the history in Home Assistant, my home automation app, as well as control the switch.
How to re-program a Sonoff wifi smart plug and control it with Home Assistant
Before you proceed check whether the Sonoff POW2 can be used in Home Assistant without modification. The Sonoff smart plug contains an ESP8266 chip (or similar). Its firmware can be replaced with different firmware so that you can use it in Home Assistant. The result is a hike in capability – the procedure appears a bit scary first time:
Edit the code in ESPhome
What we’re trying to do is to add our own more useful code to an ESP chip and thus replace the manufacturers code. In the ESPhome code below we add our wifi password and network settings. We can also add a reboot switch or wifi signal meter but below is all we need. I use this code a lot in my other projects.
# Enter the name you want to use
substitutions:
   devicename: sonoff_pow2

 esphome:
   name: {devicename}
   platform: ESP8266
   board: esp01_1m

wifi:
   ssid: "YOUR_SSID"
   password: "YOUR WIFI PASSWORD"
   manual_ip:
     # Set this to the IP you want for the ESP
     static_ip: 192.168.1.28
     # Set this to the IP address of the router. Often ends with .1
     gateway: 192.168.1.1
     # The subnet of the network. 255.255.255.0 works for most home networks.
     subnet: 255.255.255.0

sensor:
  - platform: cse7766
 current:
   name: "current"
   icon: "mdi:current-ac"
 voltage:
   name: "voltage"
   icon: "mdi:power-socket-uk"
 power:
   name: "power"
   id: my_power

  - platform: total_daily_energy
    name: "energy today"
    power_id: my_power

# Enable useful feedback
 logger:
# Enable a connection to the Home Assistant API
api:
  password: "YOUR Home ASSISTANT API password"

# OTA ENABLES over the air edits of this from now on
ota:
  password: ""


captive_portal:

uart:
rx_pin: RX
baud_rate: 4800
add the flashed POW2 to Home Assistant
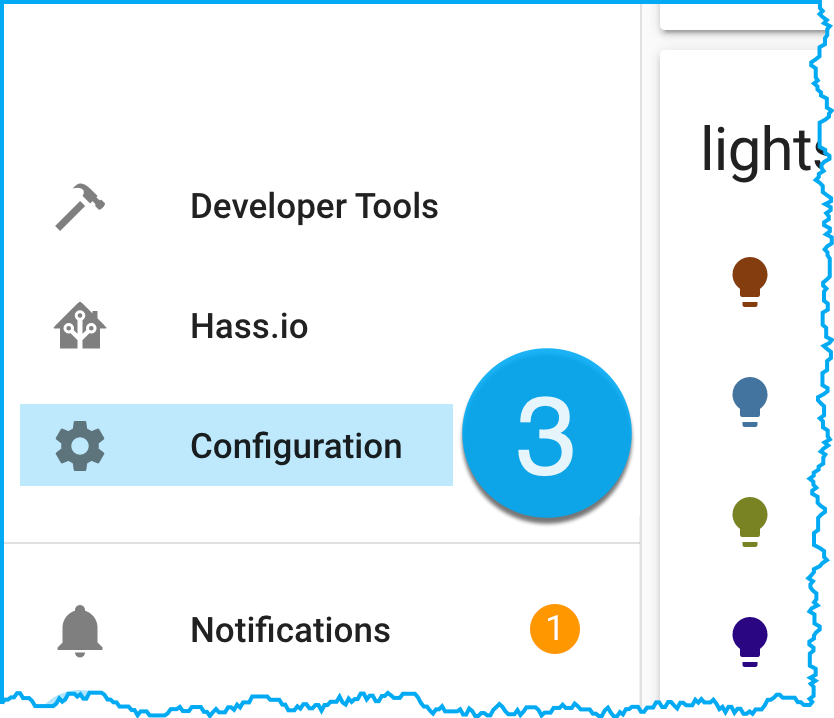
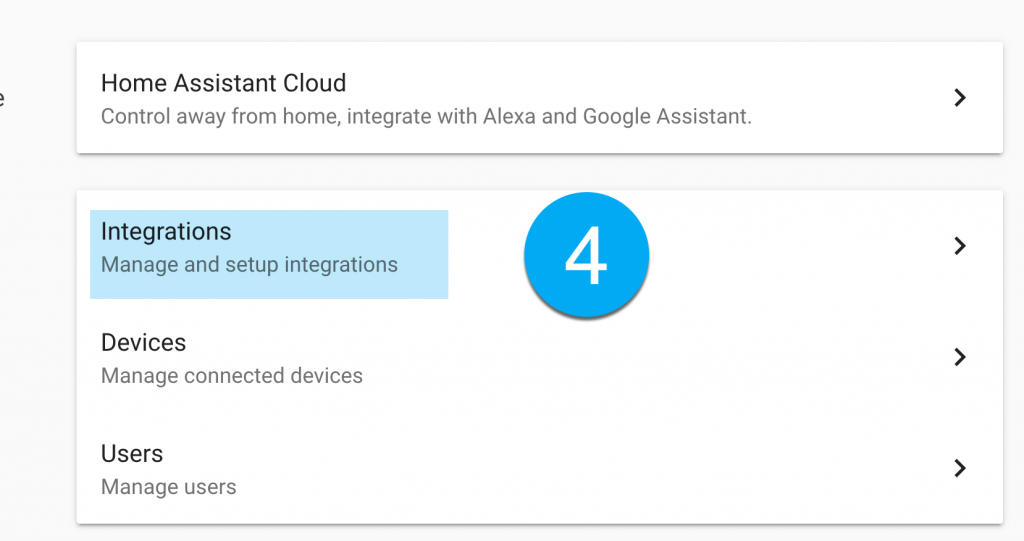
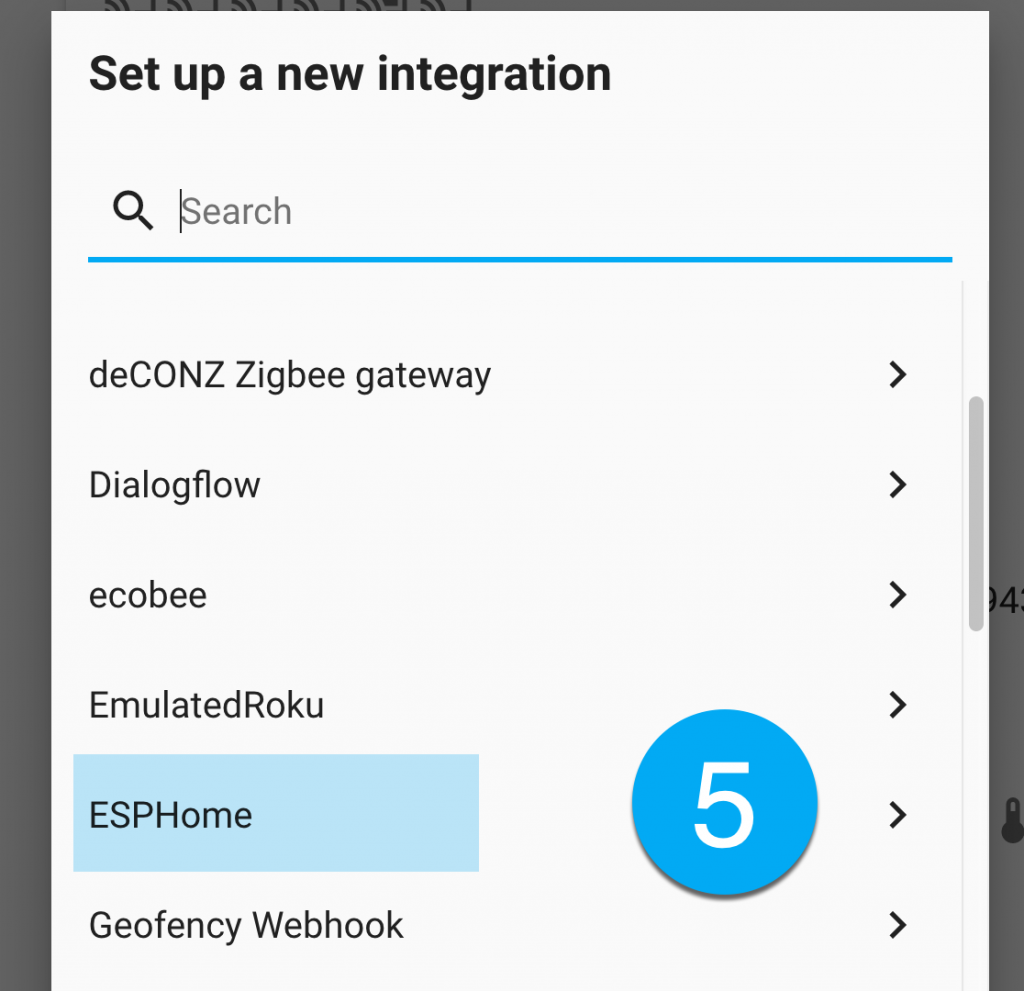
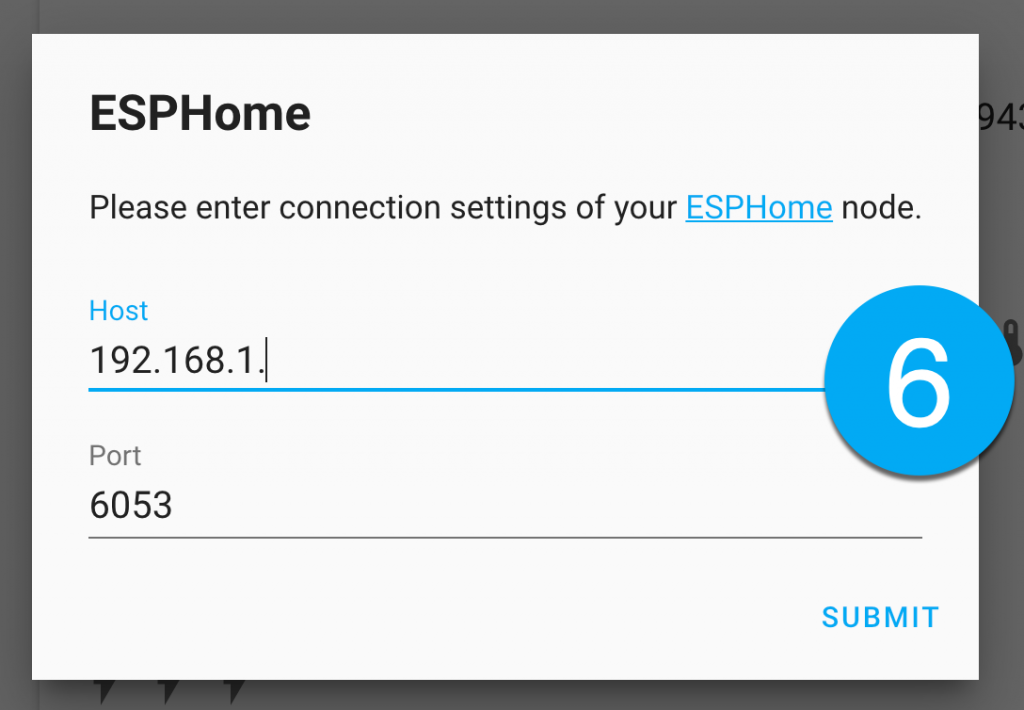
Home Assistant will usually discover an ESPHome device and notify you – taking you to step 7 below. If that doesn’t occur follow this sequence go to: Configuration > Devices & Services > integrations > ESPhome > Enter the IP address > done.
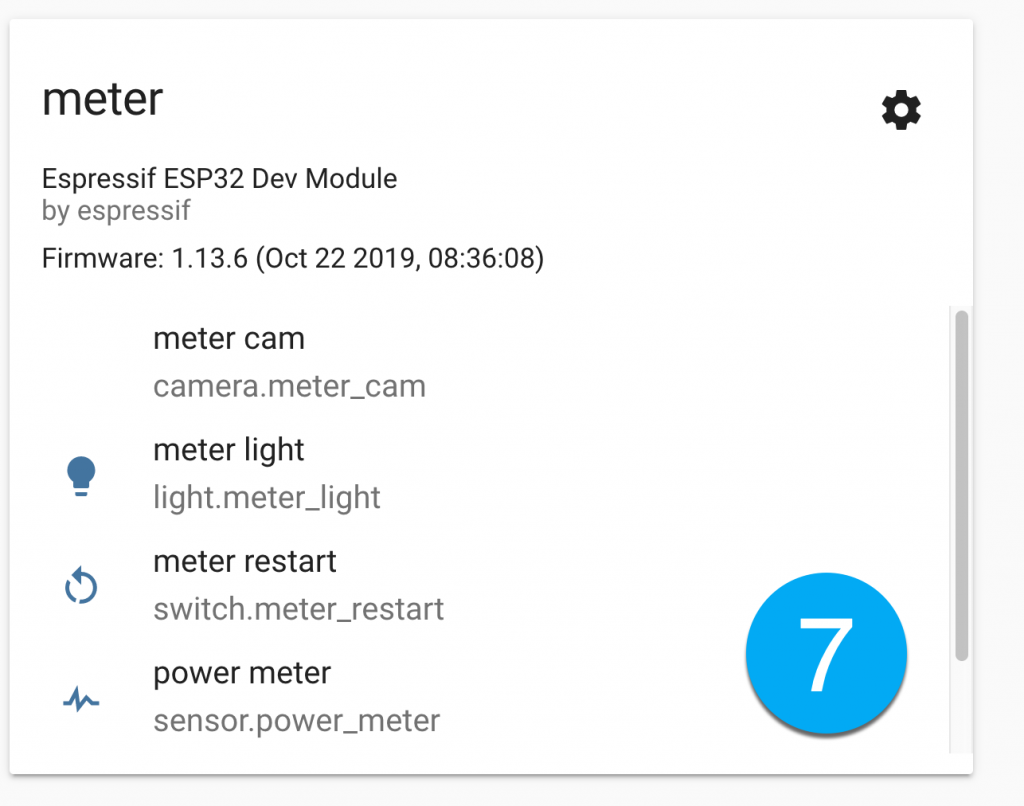
You can now control and monitor the Sonoff POW
Your Home Assistant now has a few key entities giving you the current being used, the power use right now and the power used since midnight, all added-up. Go to the Home Assistant frontend, Configure UI and add a card called a History graph.
Here’s a graph showing 12 hours use of electricity by a tall domestic freezer. I’m still drawing conclusions from what it’s telling me. The graph suggests that the freezer doesn’t use much energy, that it’s actually working half of the time and that its insulation is imperfect. Sometime in the late afternoon the freezer went through its defrost cycle. This spike, where an internal 200W heater turns on for 15 minutes, occurs around once a day.
