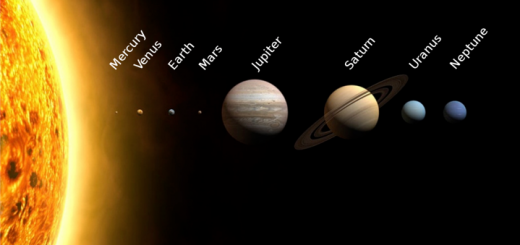
data on the planets
visitors this year: 27 Datasets (files) like the one below are useful in science. There is data to analyse by drawing graphs. The file below is in a ‘CSV’ format. Open it in your spreadsheet...
visitors this year: 27 Datasets (files) like the one below are useful in science. There is data to analyse by drawing graphs. The file below is in a ‘CSV’ format. Open it in your spreadsheet...
visitors this year: 44 Sometimes you need to graph several variables one after the other – for example, in this weather database, we plotted the daily maximum temperature against time. For clarity, we plotted...
visitors this year: 36 Datasets (files) like the one below are useful in science. There is data to analyse by drawing graphs. The file below is in a ‘CSV’ format. Open it in your spreadsheet...
rogerfrost.com is a compendium of ideas for using technology with sciencey questions in mind. Started in 1995 to offer ideas to school science teachers, Roger Frost expanded the coverage to home automation, gadgets and sensors to measure, or understand, what’s going on around him.
To find things the search box, the menu and the keywords work perfectly (and we’re totally free as in advert free).
Roger Frost has been writing about technology since 1988 and this web includes articles; radio interviews with scientists and tutorials to use technology at home and the classroom.
Please enjoy and share this content. To say hi – there’s a reply button on each page that goes straight to me in Cambridge, UK. Send a private message on this page.
HOME AUTOMATION:


